Complex and varying gas matrices make siloxanes difficult and expensive to measure. By using the Ohio Lumex Siloxane Continuous Monitoring System to measure the concentration of siloxanes prior to combustion or interconnection to a pipeline network, the plant can see siloxane breakthrough emerging real-time by species and better anticipate when the scrubber material needs to be replaced, optimizing this very expensive material, and ensuring compliance with pipeline network specifications.

GC-IMS Chromatogram
The instrument separates compounds in two separate stages:
- Gas chromatography column (vertical axis)
- Ion mobility spectrometer (horizontal axis)
Every compound has a unique set of “coordinates” on this chromatogram, allowing for distinct identification and quantification of target compounds – in this case, siloxanes.
The color scaling indicates the intensity of the signal produced when ionized compounds strike the detector.
___________________________________________________________________________________________
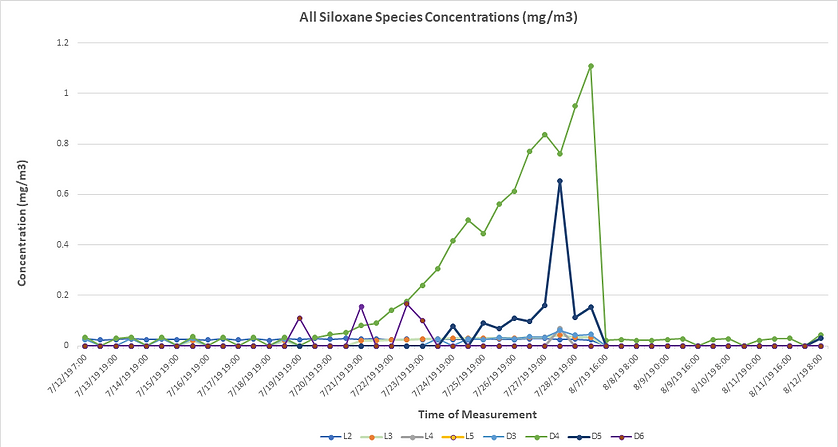
Landfill Gas-to-Energy Plant Siloxane Breakthrough Timeline
This graph shows the evolution of various siloxane species over time, as reported by a GC-IMS-SILOX currently installed at a landfill gas-to-energy plant. This plant uses a siloxane treatment material to remove siloxanes from the gas prior to combustion. By measuring the concentration of siloxanes downstream of this material, it is possible to monitor breakthrough. This information is crucial for the plant to optimize use of the scrubber material and anticipate when the material needs to be replaced.
___________________________________________________________________________________________
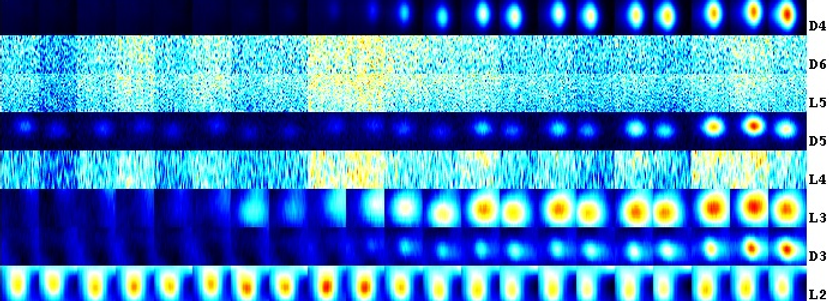
GC-IMS Gallery Plot
The gallery plot is generated by the GC-IMS-SILOX VOCal software.
It provides a visual representation of changes in siloxane concentrations over time.
The gallery plots display integration areas as a function of time, allowing for convenient visualization of changes in concentrations.