In this study, the researchers used a Zeeman atomic absorption spectrometer, with high-frequency modulation of light polarization, (RA-915+ offered by Ohio Lumex) to directly measure the mercury concentration in natural gas online. The RA-915+ revealed previously unknown short-term and long-term variability of the mercury concentration.
Variability of the Mercury Concentration in Natural Gas Reservoirs
During the operation of oil and natural gas reservoirs, concentrations of both hydrocarbons and inorganic components in extracted gases can change significantly. This variability depends on many factors, such as regional tectonic setting, structural geologic features of a deposit, seismic activity, storage of hydrocarbons, and operational conditions. In areas dissected by the intersection of deep fault zones, as in the western USA, high mercury concentrations ultimately appear.
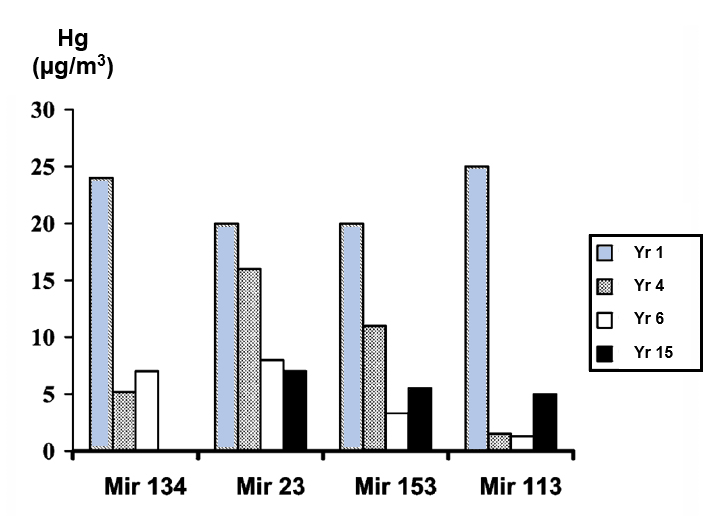
Over several years, investigations conducted at different gas reservoirs in Eastern Europe revealed substantial variability of the average mercury concentration. The long-term variability of the mercury content in natural gas reservoirs can produce significant differences in the evaluation of the chemistry, depending on the time of measurements. In five studied gas fields, the time variations in the concentration spanned from 2% to 93% of the average mercury concentration.
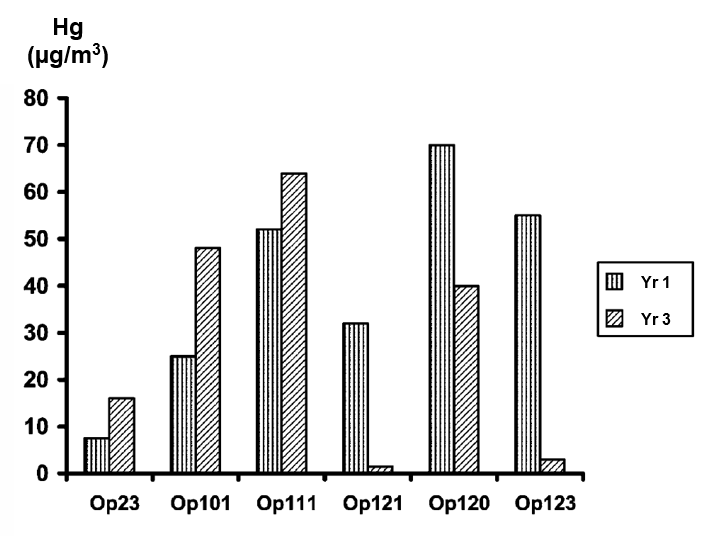
The long-term variability of the mercury concentration in individual gas wells exceeded the average fluctuation over a whole gas field. Between measurements on the same sampling site, separated by two years, the mercury concentration varied from 18 to 21 times the mean, while the mean value for the deposit remained constant. One gas well in the Mirnenskoye gas condensate deposit fluctuated from 2 to 25 micrograms per cubic meter Hg over 14 years. Chemists from the University of Oxford (2) reported that wells in the Mirnenskoye gas deposit varied from 0.05 to 40 micrograms per normal cubic meter Hg. Another gas well in the Oposhnya gas condensate deposit fluctuated from 2 to 70 micrograms per cubic meter Hg over 2 years.
Short-term (daily) Variability of the Mercury Concentration in Natural Gas Reservoirs
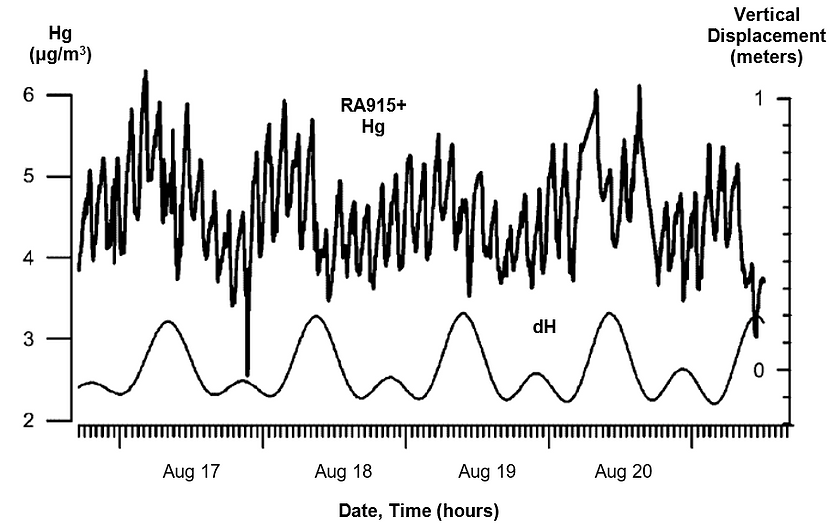
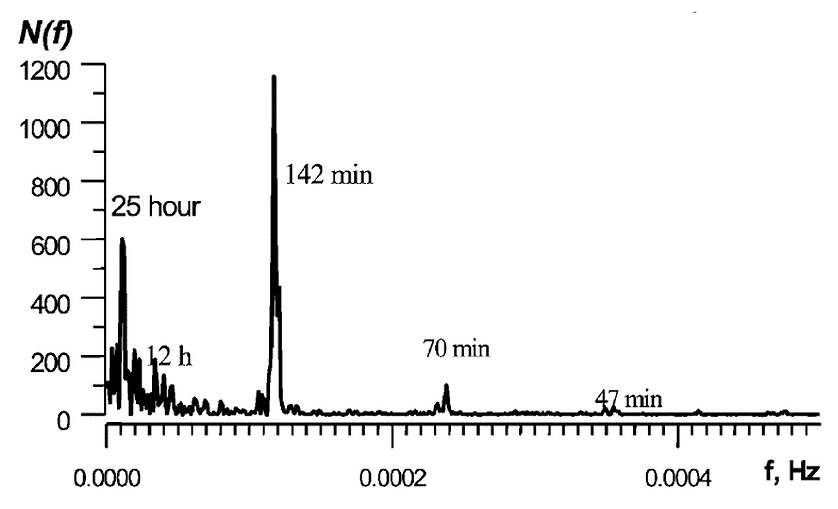
The mercury fluctuations have regular components with periods from 1 to 25 hours. A Fourier transform can represent the fluctuations as a set of harmonics with unique spectral intensity and stability in time. The middle-frequency oscillations, with a period of 1 to 3 hours, correspond with phases of the Earth’s own seismic and gravitational oscillations. The relatively low-frequency oscillations with periods of 12 to 25 hours correspond to the lunar tidal cycle, as the gravitational attraction of the Moon passing overhead raises and lowers the Earth’s surface with an amplitude of about 0.3 meters (Figure 3). The researchers hypothesized that this oscillatory mechanism drives the adsorption and desorption of mercury in the porous gas-bearing rocks.
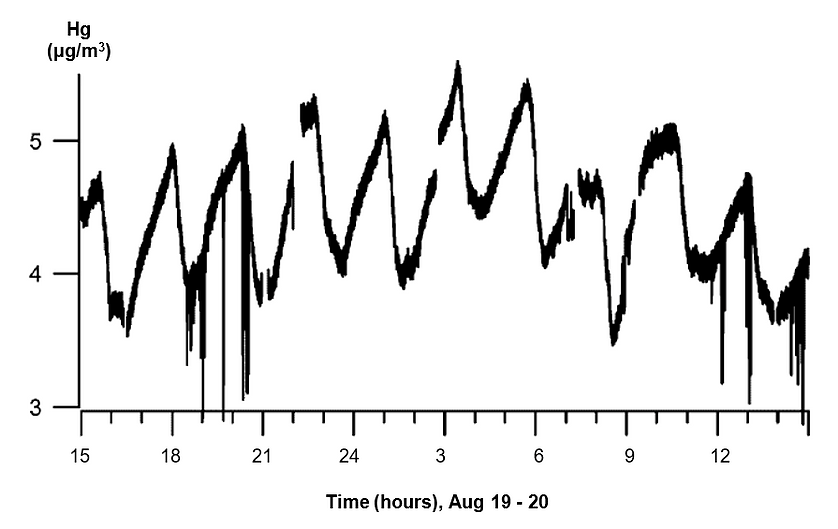
The researchers processed the collected data with a Fourier transformation to define regular spectral components. They observed relatively low-frequency oscillations in the spectra, with periods from 12 to 25 hours, as well as middle-frequency components with periods ranging from 0.3 to 2.5 hours. The frequencies oscillate independently of the average mercury concentration in the hydrocarbon gas. The middle frequency components suggest that high mechanical strain in the heterogeneous, porous rocks disturbs the equilibrium between vaporous and adsorbed phase elemental mercury.
The mercury concentration in a gas flow responds to changes in pressure and strains inside a productive layer, caused by the gas evacuation, the lunar tidal deformations, and external seismic fields. The mechanical strain, which is proportional to a seismic or tidal deformation wave, can stimulate mercury desorption from a solid surface and can also change the effective porosity of a host medium. This strain can increase the mercury vapor concentration and its rate of transfer from the porous rocks to the gas stream emerging from the operated well.
A 2012 report from the University of Oxford, Department of Earth Sciences (2) considered the quantities of mercury associated with the activities of the oil and gas industry, where it emerges in the chain of extraction, processing, and consumption.
The researchers concluded that the paucity of data available in the public domain leads to large uncertainties in the quantities of mercury contained in the oil and gas processed and consumed in the UK, and in consequent releases to the environment. Substantial variations in the mercury contents of oil and gas derived from different sources exacerbate these difficult estimations, ranging globally from 0.1 to 20,000 µg/kg in crude oil and 0.05 to 5000 micrograms per normal cubic meter in natural gas. The mercury is believed to largely accumulate through secondary geological processes.
Secondary Enrichment of Mercury
In ore deposit geology, supergene processes or secondary enrichment occur relatively near the surface, as opposed to deep hypogene processes. Supergene processes include meteoric water circulation with concomitant oxidation and chemical weathering. The descending meteoric waters oxidize the primary (hypogene) ore minerals and redistribute the metallic ore elements. Supergene enrichment occurs at the base of the oxidized portion of an ore deposit. Percolating ground water leaches metals from the oxidized ore and carries them downward to react with hypogene sulfides at the supergene-hypogene boundary. The reaction produces secondary sulfides with metal contents higher than those of the primary ore.
Secondary or supergene geological processes, including interaction with metal-rich fluids and formation waters, likely enhanced mercury concentrations. The exact nature of the processes may vary depending on local geology. For example, the high mercury content of the Rotliegend sandstone natural gas reservoirs of Europe probably originates in underlying volcanic units (similar to the geology of natural gas reservoirs in Utah and Wyoming). The exceptionally high mercury concentrations in gas from the Gulf of Thailand probably originates in nearby coal and carbonaceous shale (similar to the geology of Appalachia in Pennsylvania). In both these cases, secondary geological processes transfer mercury from the source and redeposit it within the natural gas reservoir.
Chemists commonly assume that pressure in individual natural gas reservoirs has homogenized the mercury vapor, and consequently attribute the variation observed in mercury content to inter-reservoir differences, each with distinct mercury concentrations. However, studies carried out by the University of Oxford in Russia and Ukraine have demonstrated that the concentration of mercury within even a single deposit can vary greatly, with long-term (annual) variations of 160% to 1700%. Consequently, the variation observed at a single well can exceed the variation observed across a whole deposit.
Release of Mercury During Transportation
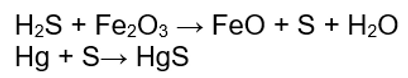
Processes such as adsorption onto metal surfaces and volatile losses reduce the mercury content of natural gas during transportation from wellhead to refinery. Chemisorption occurs as mercury reacts with, and binds to metal surfaces such as steel pipelines, container walls, and pipes within processing facilities. For example, measurements on natural gas before and after passing through a single 100 km pipeline showed the mercury concentration decreasing from 50 to 20 micrograms per normal cubic meter, a 60% decrease. H2S in trace quantities catalyzes and drives the following reactions, which crystallize mercury vapor as mercury sulfide in steel:
Many smelters in the UK set a 2000 µg/kg limit on mercury in scrap steel to avoid damage to the off gas cleanup filters, with higher concentrations requiring disposal as hazardous waste. The difficulties in disposing of material classified as hazardous waste mean that some natural gas pipelines set entry specifications that limit mercury content. This specification requires the installation of a mercury removal process prior to gas entering the pipeline, upstream of the refinery.
Concerned chemists at the University of Oxford concluded that mercury can penetrate up to 1 mm into pipeline walls, and this chemisorbed mercury can easily remobilize over extended periods of time, thereby contributing to the mercury burden of the transported hydrocarbon gas.
In April 2011 the UK operated 15,407 km (9,552 miles) of pipelines on their continental shelf, primarily transporting offshore crude oil and natural gas to onshore terminals. To establish an upper bound on the mercury retained within their pipeline network, Oxford chemists assumed that if 2000 µg/kg (2 ppm) of mercury absorbed, over many years, up to a 1mm depth across the whole pipeline system, with an average pipeline diameter of 0.27m (10.6 inches) and density of 8 tonnes/cubic meter, then UK pipeline walls could store up to 207 kg of mercury total.
The highly integrated U.S. natural gas pipeline network moves natural gas throughout the continental United States. The pipeline network includes about 3 million miles of mainline and distribution pipelines that link natural gas production areas and storage facilities with consumers. This natural gas transportation network delivered more than 25 trillion cubic feet (Tcf) of natural gas in 2016 to about 74 million customers.
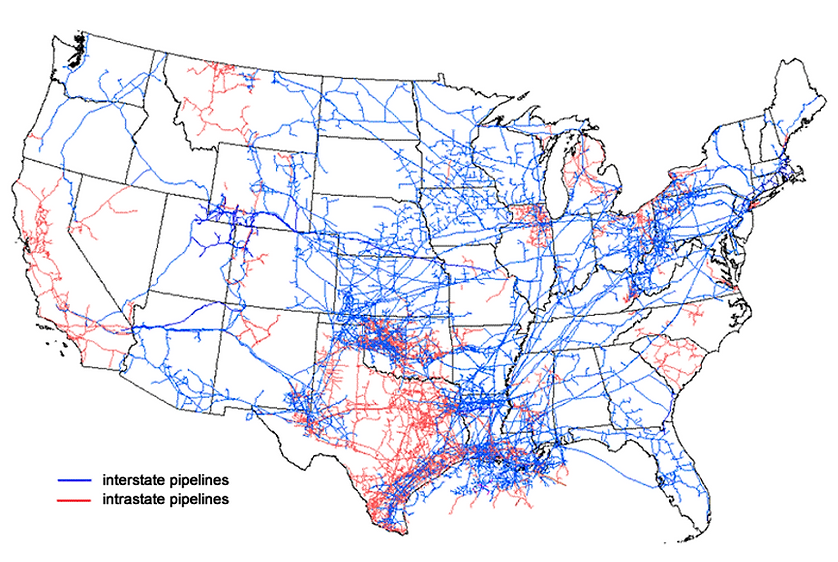
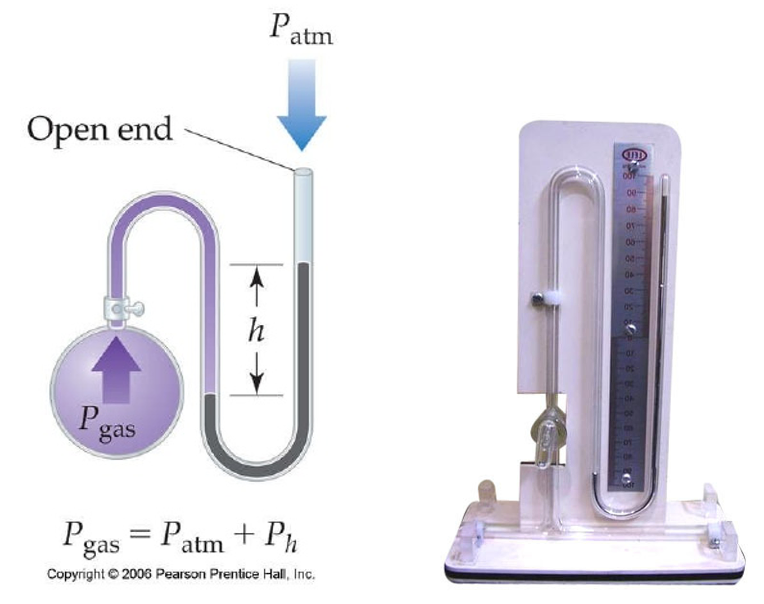
If one applies the UK ratio (207 kg Hg / 9,552 miles or 0.02 kg Hg / mile) to the USA, then our 3-million-mile-long natural gas pipeline network could contain up to 65,012 kgs of absorbed mercury in its walls. In the past, old mercury containing manometers (Figure 7), used to measure pipeline pressure, could have exacerbated this problem by malfunctioning during depressurization and leaking liquid mercury into the pipelines.
Mercury Lost During Natural Gas Processing
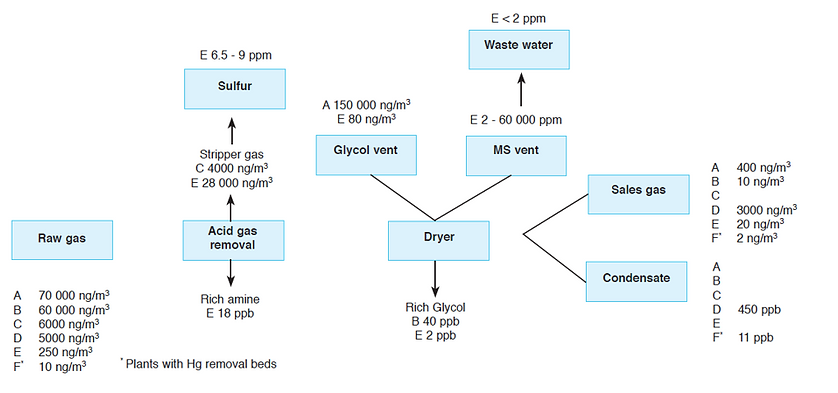
Estimates for the quantity of mercury lost during natural gas processing include 11% removed by the total plant, 60% removed at the bottom of the glycol absorbers, and 20% removed in acid gas scrubbers. Consequently, processing plants lose an estimated 11% – 80% of the mercury contained in the natural gas to the atmosphere.
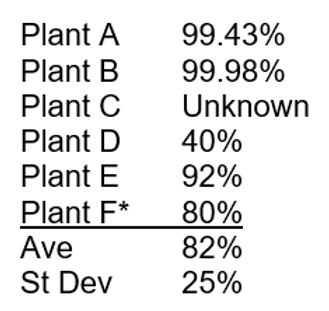
The proportions of mercury removed at various stages and entering the finished product and condensate vary greatly from plant to plant, as illustrated in Figure 8. The variation across six processing plants spans a large range, with the mercury removal efficiency in the sales gas varying from 99.98% at plant B to 40% at plant D, when compared with raw gas. Plant F, the only plant to feature a mercury removal unit, still loses some mercury, with 80% mercury removal efficiency. The average mercury removal efficiency for five plants is 82% ± 25%.
Efficiency of mercury removal from Raw Gas by processing plants, as measured in Sales Gas:
Ohio Lumex offers four products to optimize the efficiency of mercury removal in natural gas process plants:
- AMNG-EXP on-line analyzer for monitoring mercury in raw gas and sales gas pipelines
- RA-915J mercury continuous emissions monitor (CEM) for process control in plant vents or stacks
- RA-915M with RP-92 attachment for measuring mercury in wastewater
- Sorbent Trap sampling systems for emissions compliance and testing
Ohio Lumex developed sorbent trap methods with the primary objective of simplifying emissions compliance and engineering testing. Sampling methodology has been inspired by EPA and industry accepted methods and continues to improve.
Traps have opened the door to economic and high-quality data acquisition that can be used not only at the refinery, but also upstream in traditionally difficult-to-test environments. These types of measurements have the potential to help refineries operate more efficiently and reduce long-term operating costs.
References
1. Regular Variations of the Mercury Concentration in Natural Gas
Vladimir V. Ryzhova, Nikolai R. Mashyanova, Nina A. Ozerovab, Sergey E. Pogareva
Institute of the Earth’s Crust, St. Petersburg State University, 7/9 Universitetskaya nab., 199034 St. Petersburg, Russia
Institute of Geology of Ore Deposits, Petrology, Mineralogy and Geochemistry, Russian Academy of Sciences (IGEM RAS), 35 Staromonetniy per., 109017 Moscow, Russia
Received 13 February 2002; accepted 15 October 2002
2. Mercury arising from oil and gas production in the United Kingdom and UK continental shelf
David Lang, Dr Murray Gardner, Dr John Holmes
University of Oxford and Natural Environment Research Council
Integrating Knowledge to Inform Mercury Policy (IKIMP)
University of Oxford, Department of Earth Sciences
South Parks Road, Oxford, OX1 3AN, United Kingdom
Telephone: +44 (0)1865 272000
Published: January 2012